library(ggplot2)
library(dplyr)参考教程 / Reference Tutorials
- 思问 & StatisticVision. (2025, March 14). R语言绘图25|Nature曼哈顿图复现 [微信公众号]. R语言绘图25|Nature曼哈顿图复现. https://mp.weixin.qq.com/s/3YlnB3Nm85v3FxE8F67oDw
基本信息 / Basic Information
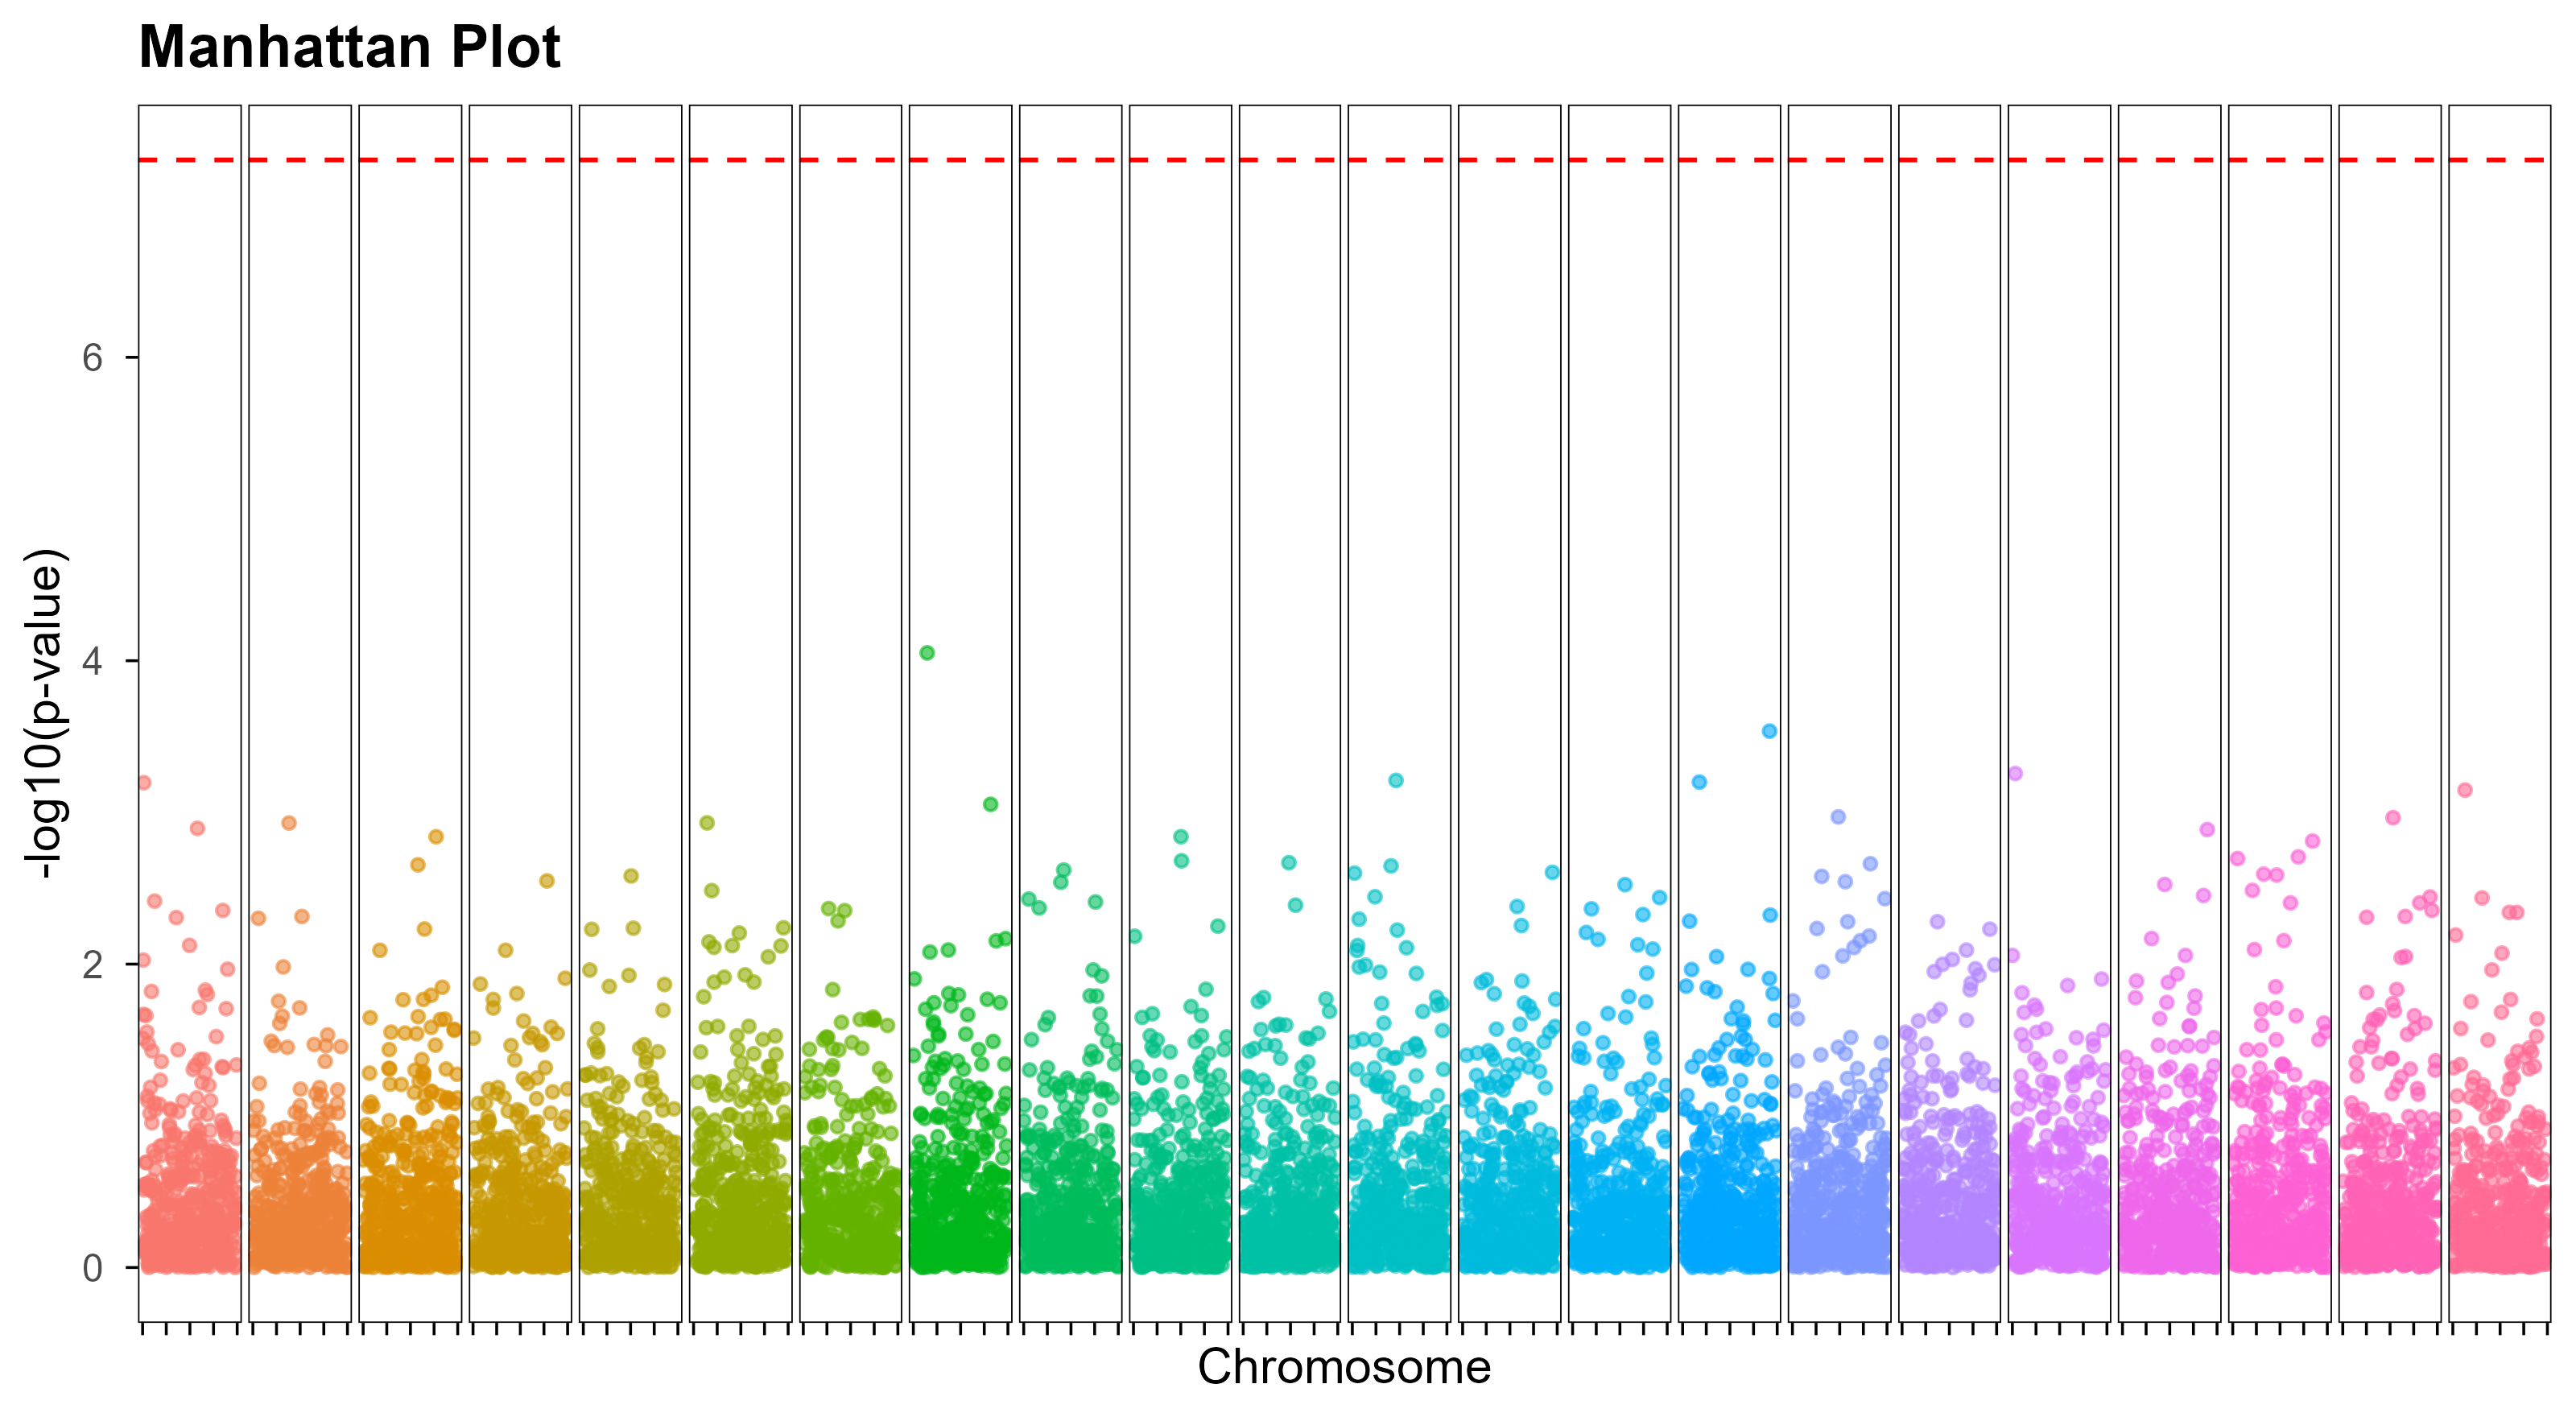
曼哈顿图(Manhattan Plot)是基因组范围内关联研究(GWAS)中常用的可视化工具,用于展示单核苷酸多态性(SNP)与表型之间的关联。它通过在x轴上绘制基因组位置,在y轴上绘制-log10(p-value)来显示每个SNP的显著性水平。
The Manhattan plot is a visualization tool commonly used in genome-wide association studies (GWAS) to display the association between single nucleotide polymorphisms (SNPs) and phenotypes. It shows the significance level of each SNP by plotting genomic position on the x-axis and -log10(p-value) on the y-axis.
曼哈顿图的特点 / Features of a Manhattan Plot
X轴: 基因组的位置,按照染色体编号和物理位置排列,每条染色体用不同的颜色区分
X-axis: genomic position, arranged by chromosome number and physical position, with each chromosome distinguished by a different color
Y轴:用-log10(p-value)表示SNPs的显著性水平,越高表示显著性水平越高
Y-axis: -log10(p-value) represents the significance level of SNPs; the higher the value, the more significant
阈值线:图中与X轴平行的一条线,表示不同的显著性水平,分别对应p-value的某些值,比如p<5x10⁻⁸
Threshold line: a line in the plot parallel to the x-axis, indicating different significance levels, which correspond to certain p-value values, such as p<5x10⁻⁸
点: 每一个点表示一个SNPs,其高度表示显著性程度
Points: each point represents a SNP, and its height indicates the degree of significance
相关脚本 / Related Scripts
通过 Listing 1 加载了需要用到的的 R 包。
The required R packages are loaded via Listing 1.
生成模拟数据
Generate simulated data
Code
set.seed(42)
data <- data.frame(
  SNP=paste0("rs",1:10000),
  CHR=rep(1:22, length.out=10000),
  BP=sample(1:1e6, 10000),
  P=runif(10000)
)| SNP | CHR | BP | P |
|---|---|---|---|
| rs1 | 1 | 61413 | 0.4715924 |
| rs2 | 2 | 54425 | 0.5765097 |
| rs3 | 3 | 623844 | 0.2229165 |
| rs4 | 4 | 74362 | 0.3966966 |
| rs5 | 5 | 46208 | 0.3641330 |
| rs6 | 6 | 964632 | 0.6577111 |
计算-log10(p-value)
Compute -log10(p-value)
Code
data <- data %>%
mutate(logP = -log10(P))| SNP | CHR | BP | P | logP |
|---|---|---|---|---|
| rs1 | 1 | 61413 | 0.4715924 | 0.3264332 |
| rs2 | 2 | 54425 | 0.5765097 | 0.2391934 |
| rs3 | 3 | 623844 | 0.2229165 | 0.6518579 |
| rs4 | 4 | 74362 | 0.3966966 | 0.4015415 |
| rs5 | 5 | 46208 | 0.3641330 | 0.4387400 |
| rs6 | 6 | 964632 | 0.6577111 | 0.1819648 |
画图展示相关的数据
Plot the data
Code
ggplot(data, aes(x=BP, y=logP, color=as.factor(CHR)))+
  geom_point(alpha = 0.6, size = 1)+
  facet_grid(. ~ CHR, scales = "free_x", space = "free_x")+
  geom_hline(yintercept = -log10(5e-8), linetype = "dashed", color = "red")+
  labs(title = "Manhattan Plot",
       x = "Chromosome",
       y = "-log10(p-value)",
       color = "Chromosomes" ) +
  theme_blog() +
  theme(strip.text.x = element_blank(),
        panel.spacing.x = unit(0.1, "lines"),
        axis.text.x = element_blank(),
        legend.position = "none")